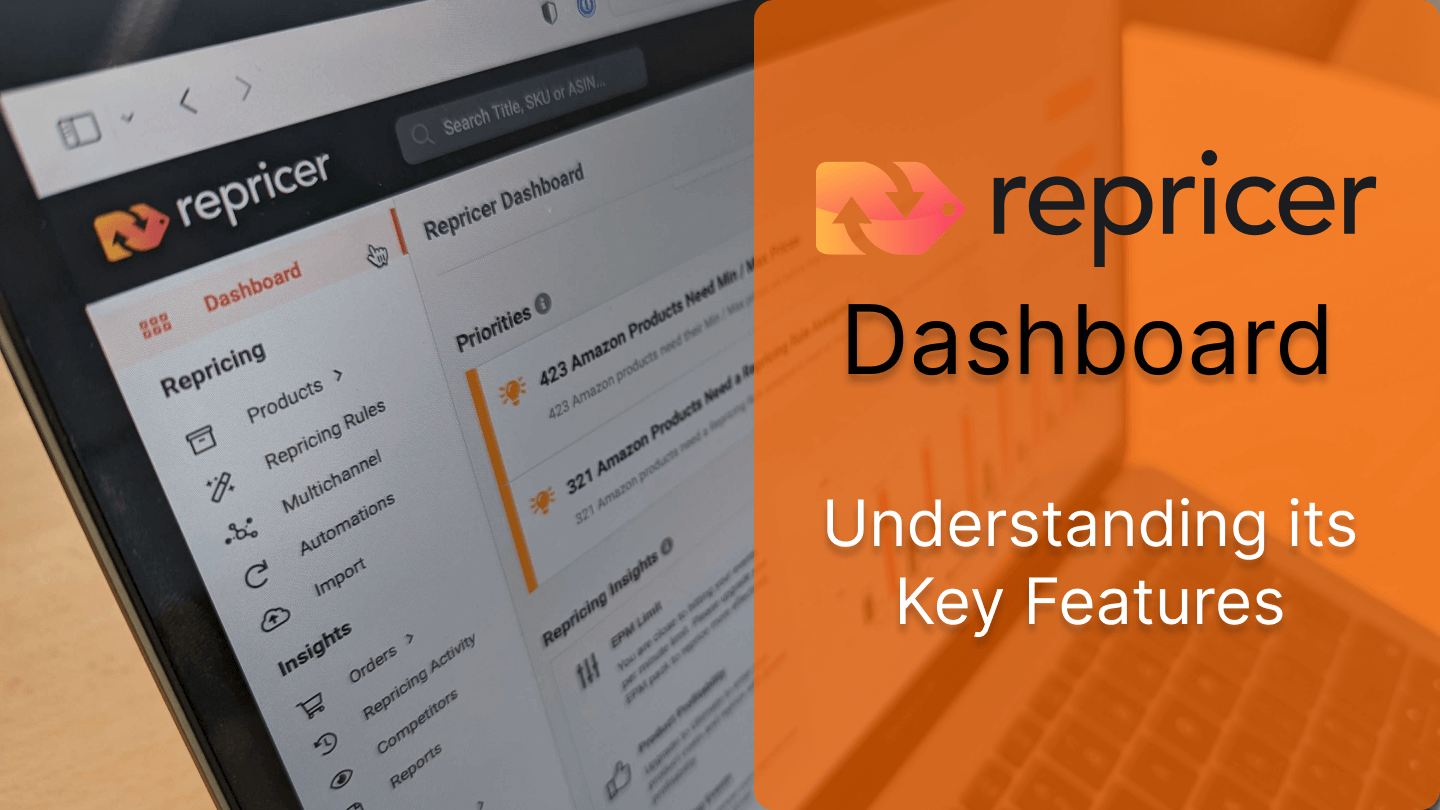
In this article, we are going to discuss the Repricer dashboard, its key features and what you can expect from it. You’ll get tons of important information on how your very own repricer is performing whilst suggesting actions that you can take quickly to improve the performance of your products. So here, we’ll break down each section to fully understand what it entails and how this can help you to make informed decisions to develop your repricing strategy.
Product Header Overview

This section provides a quick overview of your current subscription and product details. So, firstly it shows what plan you are currently on with Repricer. To the right of that, it tells us how many product listings are currently imported.
At Repricer, we have 4 plans to choose from. Each plan has a maximum number of listings you can add:
- Express: 5,000 listings
- Plus: 50,000 listings
- Ultimate: 250,000 listings (as shown)
- Extreme: 1 Million listings
Next to this, out of your total product listings, we then have the configured products. These configured products are the product listings that are set up and ready to reprice. It will also display products that are currently unconfigured which simply need their Min/Max prices or a repricing rule assigned. And finally to the right of this, we have a section showing how many of the products are currently winning the Buy Box.
Priorities

So next, we’ll take a look at the priority section. This is a dynamic section, so it will change all the time depending on the actions that you take and it will give you new insights and ways to quickly improve your performance. So, as shown, it’s pointing out that there are certain products that need a Min and Max price assigned. Clicking on the button to assign the Min and Max prices would bring us to the products page where we can quickly assign those prices to our listings.
Below the section assigning Min and Max prices, there is another priority section where it will display any products that need a repricing rule assigned. So again, if you click the button here it will bring you to the products page and you can assign a pricing rule to those certain products.
Repricing Insights
There are a few key features we’ll discuss within Repricing Insights that can quickly display important metrics on how well your sales and revenue are performing.
EPM Limit

The first element we have under repricing insights is the EPM limit. EPM relates to an ‘event per minute’. An event is when a price change triggers your Amazon, eBay or another marketplace you are set up in to send a notification to Repricer.com. It’s best to keep an eye on events per minute as there is a limitation on your EPM depending on what pricing pack you’re on.
The EPM graph is also interactive, so if you want to remove the events and just look at the actual repricing, you can. You will also be able to see the times that your products were priced up, in green and the times your products were priced down, in red.
Product Profitability
The product profitability feature will give you a breakdown analysis of how profitable your products are. Here you’ll have to import your costs into Repricer.com to see this, which is available on the ultimate plan or above.
Repricing Events
Next, you have repricing events similar to the EPM events. This shows how many times your products were repriced both up and down.
Buy Box Ownership

You can also view your Buy Box ownership where you’ll be able to see products you’re selling that are currently winning the Buy Box, currently not in the Buy Box or even your products that partially own the Buy Box.
Win Back the Buy Box

This section provides opportunities for you to win back the Buy Box. Here it will display products that recently lost the Buy Box. By clicking on the ‘Manage Products’ button, it will direct you straight to those products where you’ll be able to take action to possibly price more aggressively to win back to the Buy Box.
Buy Box Predictor

The Buy Box Predictor provides insight into the probability of your products winning the Buy Box. Products within the green area have a really good chance, products in the orange area have a medium chance finally products in the red area may have a very low probability of winning the Buy Box.
What’s interesting is that you can click on any one of these coloured areas and it will direct you to a list of those products. So it may be worthwhile taking action on any products listed in the red area and developing a repricing strategy around these. Simply click on these products and you can then assign a different type of rule to them to help them reprice more competitively.
Most Improved Products

This section provides a quick glimpse of your best-performing products recently.
Sales Performance

The Sales Performance graph summarises the total sales of your configured products. The number of sales you’ve made is shown within the red columns and the linear graph in green displays the dollar value of those certain sales.
Out of Stock Products

In the Out of Stock Products section, you can see which of your products are currently out of stock. Clicking on ‘Manage Products’ will display a list of those said products where you can then increase their minimum price so that when they come back in stock they’re at a higher price or you can even assign a special rule to them.
Product Sales Analysis

You can also see an analysis of your top 50 products by Greatest Total Revenue. It may display the top five, however, if you click the ‘View the Top 50’ button it will automatically drop down the full list where you can view your total sales from yesterday, last 7 days, last 30 days or over a custom period if you prefer. If you also have your costs factored in it will present your total profit for that certain time.
Profitability Trend

Finally, if you have your costs included you’ll be able to see an overview of your profitability trend where your profitable sales are shown within the green columns and the unprofitable sales in red. Any sales where profitability is unknown is simply where you don’t have the costs incorporated. So, by simply adding your costs to each of these products will provide greater insight into how your overall selling strategy is performing.
Summary
So that’s everything you need to know and understand within the Repricer dashboard. It’s a good idea to always refer back to your dashboard from time to time as you can get some really helpful suggested actions for your products, and how they’re performing whilst getting really powerful insights into your revenue and sales.
If you haven’t already signed up for your 14-day free trial, this is the time. Repricer.com allows sellers to offer consistently competitive prices across multiple marketplaces and webstores. The automatic repricing software analyzes product demand, competitor prices, Buy Box opportunities and more to ensure sellers are staying ahead of the competition.


